
エディオングループは、気候変動対応を重要な経営課題の一つと認識しており、2021年7月に「TCFD(気候関連財務情報開示タスクフォース)※」の提言に賛同しました。気候変動が当社グループの事業に与えるリスクと機会を分析し、経営戦略・リスクマネジメントに反映するとともに、その進捗を適切に開示し、社会全体の脱炭素化に貢献しながら、さらなる成長を目指します。
なお、TCFDの提言に基づき、気候変動に対する「ガバナンス」「戦略」「リスク管理」「指標及び目標」について、以下に開示します。
- * TCFD is an abbreviation for "Task Force on Climate-related Financial Disclosures". At the request of the G20, the Financial Stability Board (FSB) discloses climate-related information and changes climate. It was established to consider the response of financial institutions to. In June 2017, we published a recommendation to disclose the effects of climate change in financial reports of financial institutions and companies.
Governance
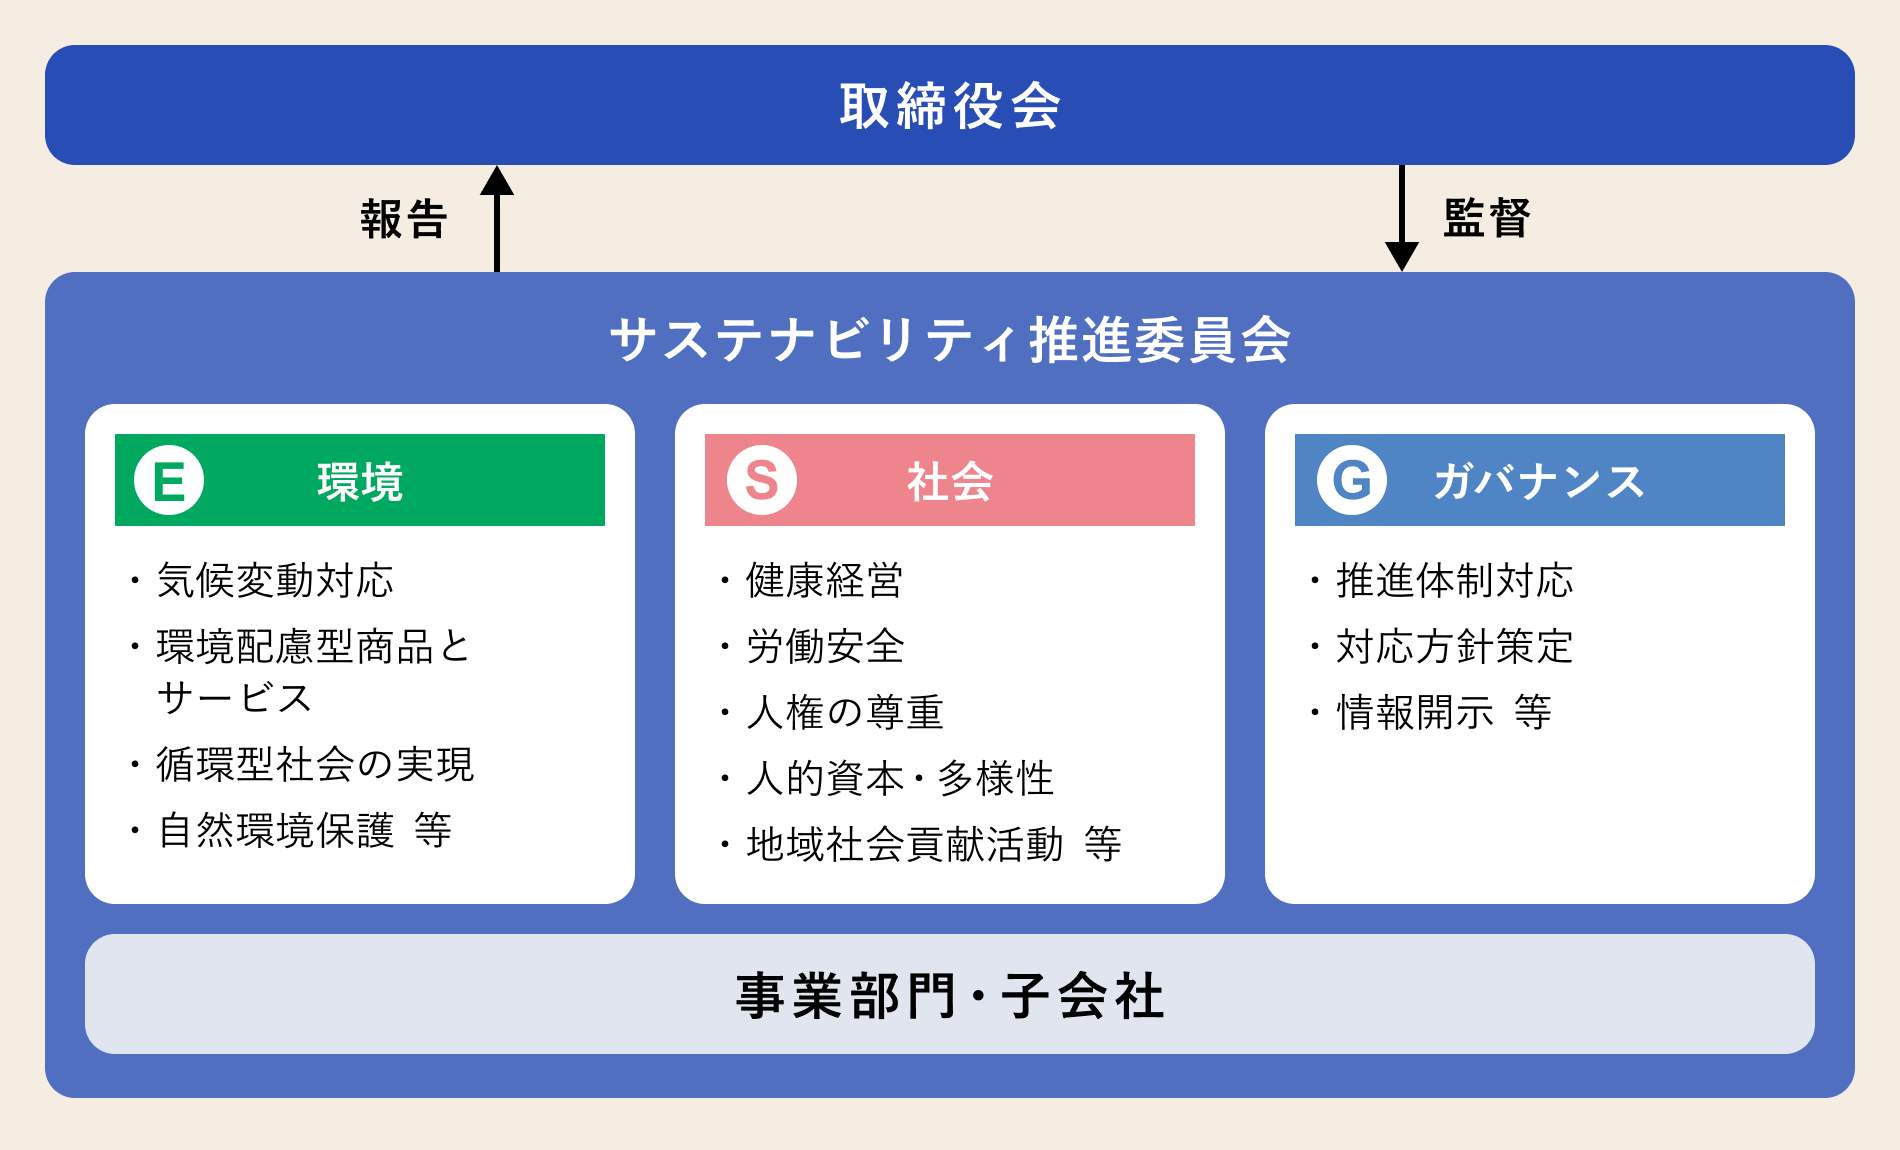
エディオングループでは、気候変動に伴うリスク及び機会は事業戦略や財務計画に大きな影響を及ぼすものと認識しており、これらに対するガバナンス体制として、サステナビリティ推進委員会を設置しました。
サステナビリティ推進委員会では、気候変動を主要テーマの一つとし、TCFD提言に則した情報開示項目の整理と温室効果ガス(GHG)排出量の可視化及び削減方法の検討、気候関連に係る重要事項の議論や対応方針の策定等を行うとともに、目標に対する施策の進捗状況を把握し、取締役会に報告を行っています。
また、取締役会は監督機関として、サステナビリティ推進委員会で審議した気候関連の課題と目標、対応について適宜報告を受け、重要事項については必要に応じて審議・監督を行っています。
Strategy
[Scenario analysis]
エディオングループは、台風・豪雨の激甚化等の気候災害の拡大及び脱炭素化等の気候変動緩和に向けた全世界的な取り組みが経営とビジネス全体に重大な影響を与える重要課題であると認識しています。気候変動が当社グループに与えるリスク及び機会とそのインパクトの把握、2030年時点の世界を想定した当社グループの戦略のレジリエンスと追加施策の必要性を検討するため、シナリオ分析を実施しました。
その結果、消費者のライフスタイルの変化への追随、気候変動への緩和や適応への対応、炭素税や省エネルギーに関する法規制の強化への対応が焦点となる課題であることが判明しました。
シナリオ分析では、国際エネルギー機関(IEA)や、気候変動に関する政府間パネル(IPCC)が公表する複数の既存シナリオを参照のうえ、パリ協定の目標である「世界の平均気温上昇を産業革命以前に比べて2℃より十分低く保ち、1.5℃に抑える努力をすること」を想定した「1.5℃/2℃シナリオ」及び現在のペースでGHGが排出されることを想定した「4℃シナリオ」の2つの世界を想定しています。
気候関連の規制の強化や市場の変化・消費者の嗜好等の移行リスクが顕在化する「1.5℃/2℃シナリオ」にはIEA NZE 2050を、自然災害等の物理的リスクが顕在化する「4℃シナリオ」にはIPCCによるSSP5-8.5とRCP8.5を選定しました。なお、1.5℃と2℃のシナリオにおいては、リスク及び機会の傾向は同じですが、1.5℃の方が2℃よりも気候変動への対応スピード及び活動レベルを強化していく必要性があると認識しています。
シナリオ分析の対象範囲は、2030年の世界を想定して、特に気候変動の影響を受ける可能性のある家電、リフォーム、物流事業に関連するグループ会社8社のサプライチェーン全体としました。
また、気候変動の影響は長い時間をかけて顕在化していく可能性があることを踏まえ、短期、中期、長期の時間軸を定義しています。
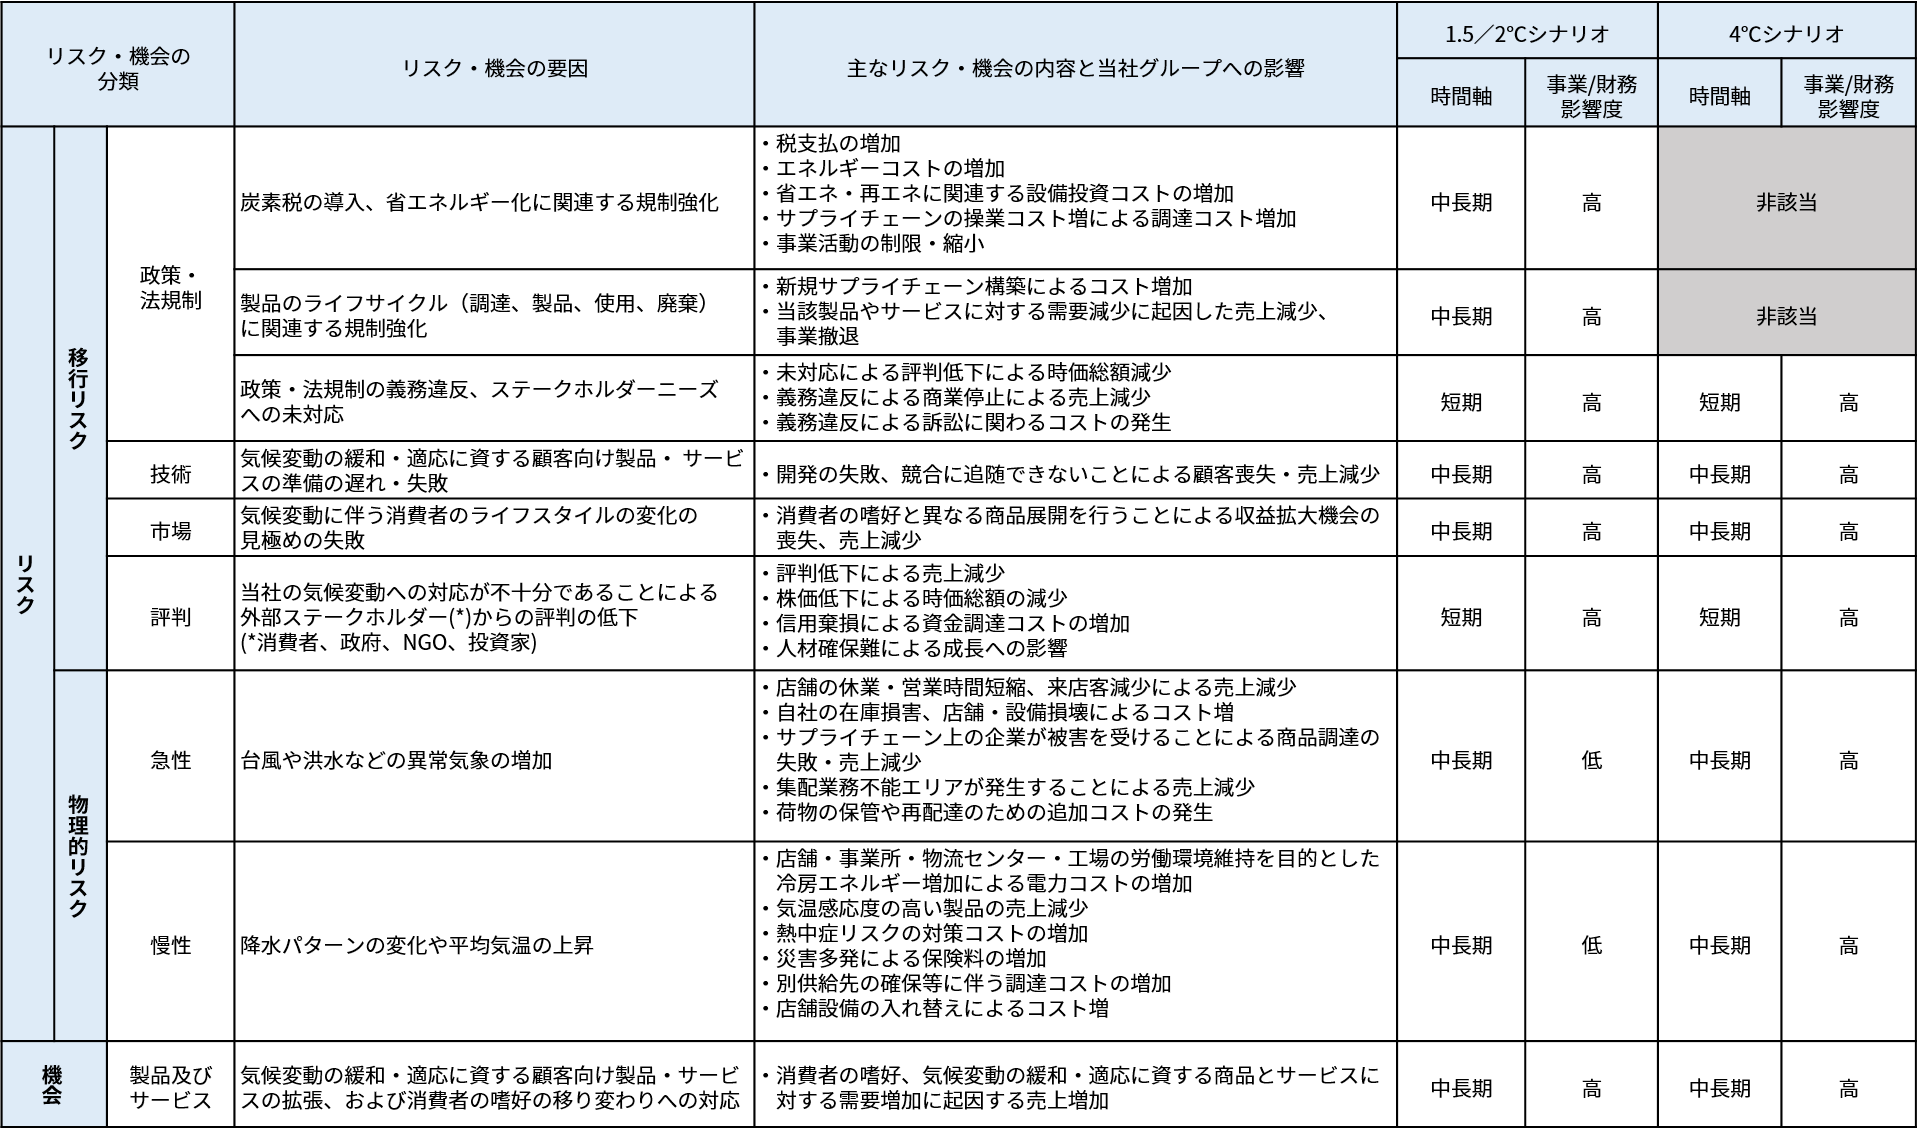
この2つのシナリオを踏まえ、TCFD提言に沿って、気候関連のリスク及び機会を抽出しました。そのうえで、気候変動がもたらす移行リスク(政策・法規制、技術、市場、評判)、物理的リスク(急性、慢性)、及び機会(製品及びサービス)を特定しました。
| Reference scenario | 1.5/2°C scenario: IEA NZE 2050 4°C scenario: IPCC SSP5-8.5, RCP8.5 |
|---|---|
| Target business scope | Eight group companies related to home appliances, renovations, and logistics businesses |
| Target year | Impact as of 2030 |
| Time axis | Based on the fact that the effects of climate change may become apparent over a long period of time, the short-term and medium- to long-term timelines are defined as follows.
・Short-term: Current to 1 year ・Medium term: 1 to 5 years ・Long term: 5 years ~ |
【シナリオ分析結果】
シナリオ分析の結果、1.5℃/2℃シナリオ、4℃シナリオいずれのケースにおいても、消費者のライフスタイルの変化への追随に失敗すること、気候変動への緩和や適応への対応の遅れによる評判の低下が当社グループにとって重大なリスクであることが判明しました。一方で継続的なシナリオ分析を通して他社に先んじて1.5℃/2℃シナリオ及び4℃シナリオの世界のいずれにも迅速に対応できる事業戦略を構築し実行することにより、リスクを機会に転じさせることもできると考えています。
例えば、1.5℃/2℃シナリオにおいては、炭素税や省エネルギー化に関連する規制強化が想定されているため、当社グループにとってはコスト増加につながります。2030年時点において、最も財務に影響を与えるリスクは炭素税の導入によるコスト増加であり、その影響金額は約17億円と予測しています。
しかしながら、脱炭素化に向けて省エネや建築物ZEB化の規制が進行し、GHG排出量の規制が強化され、それらに伴う社会意識の変化への対応を進めていく中、エネルギー効率が高くGHG排出量の低い製品への需要が拡大することは、家電やリフォーム事業を展開する当社グループにとっては機会でもあると考えています。
また、4℃シナリオにおいては、自然災害が激甚化した結果、被災による被害が発生するとともに、サプライチェーンの分断によって納品が遅延することに伴う販売機会の損失が見込まれます。しかしながら、平均気温が上昇する中で自社の室温や湿度を一定に保つために空調機器のエネルギー消費量が増加し、空調コストの増加が見込まれる中、エネルギー効率の高い空調機器への需要が拡大することは当社グループにとっては機会でもあると考えています。
このシナリオ分析を通じて気候関連のリスク及び機会の影響を認識し対応策を検討することにより、当社グループの事業上のリスクの低減と価値創出の機会の最大化を図り、持続可能かつ安定的な収益を長期的に確保することを目指していきます。
The main risks and opportunities facing the Group are as follows:
〈気候関連のリスク及び機会〉
【リスク及び機会を踏まえた取り組み・対応】
エディオングループでは、シナリオ分析の結果を踏まえて、店舗設備や事業活動において脱炭素化の取り組みを強化しています。店舗等ではGHG排出量を削減する運営を目指し、太陽光発電設備の設置による再生可能エネルギーの活用や、LED照明などの省エネ設備の導入を進め、エネルギー管理システム(EMS)の設置、空調機器の省エネ部品の導入などによるエネルギー制御にも取り組んでいます。また、事業活動においても省エネ製品・サービスの提供を通じて、脱炭素化の重要性をお客様に理解していただく活動をはじめ、敷地内駐車場での電気自動車充電スタンドの設置や、敷地・屋上・壁面の緑化など、脱炭素社会の実現に向けた取り組みを積極的に行っています。今後も継続して店舗等での省エネ効率などを研究しながら、環境に配慮した効率的な店舗体制の強化を図っていきます。
1.5℃シナリオで想定される各法令の規制強化に伴う対応コストを低減することを目的の一つとして、設備の更新時期やテナントの入れ替え、店舗の新設に合わせて、自家消費型太陽光発電設備の導入、省エネ型照明・空調機器への切り替え、デマンドレスポンス(DR)契約などを進めています。なお、2023年に新設した岐阜正木店と交野星田店においては、持続可能な店舗運営の実現に向けて徹底的な省エネと創エネに取り組み、省エネ+創エネで年間の一次エネルギー消費量を正味25%以下まで抑えることに成功し、「Nearly ZEB(ニアリーゼブ)」の認証を取得しています。
また、家電直営店舗における省エネ・節電の取り組みとして、塔屋・外壁サインの照明消灯、店内空調機器の温度設定、空調フィルターの適切な清掃、店内照明の速やかな消灯、展示品の一部電源オフなどを実施し、電力やガス使用を抑制することで、Scope1・2におけるGHG排出量の総量削減に寄与しています。
当社グループは、売上高の8割以上を占める家電及びリフォーム事業において、省エネ性能の高い家電製品や家庭用太陽光発電設備、高断熱リフォームなどの販売を積極的に進めることを機会と捉えています。家電製品アドバイザーやスマートマスター等の資格取得や研修等を通じて、全国各店舗における省エネ分野に関する幅広い専門知識を有する従業員を増やすことを推進しています。この取り組みにより、Scope3カテゴリー11(販売した製品の使用)や、サプライチェーンを通じたScope3カテゴリー1(購入した製品・サービス)のGHG排出量削減に寄与します。このほか、物流サービス拠点の一部では、商品配達時に排出される発泡スチロールの減容と再資源化を行い、これにより運搬車両は通常の1/20の台数となり、Scope3カテゴリー4(輸送・配送)のGHG排出量を抑制しています。
4℃シナリオで想定される自然災害の激甚化に伴う損害・対応コストの低減では、洪水や氾濫のリスクと集中豪雨による洪水の被害を想定し、いち早く対応できるように防災訓練を実施するなどリスクに対応できる体制を整えています。また、記録的な大雨や集中豪雨における事業所及び店舗内の浸水や、浸水による家電製品等への被害が極力発生しないように、一部店舗においては排水ポンプの設置や屋上・駐車場等の防水工事を実施しています。今後も適切な計画を立て、修繕、操業、訓練、外部情報活用等による自然災害への備えを行っていきます。
また、当社グループでは、特定家庭用機器再商品化法(家電リサイクル法)の対象である使用済み家電製品の適正な処理をはじめ、発泡スチロールなどの廃棄物の分別や再資源化に取り組んでいます。子会社の㈱イー・アール・ジャパンでは、グループ各社で回収した使用済み小型家電のリサイクルやパソコンなどのリユースを事業としており、持続可能な循環型社会の実現に貢献することは企業の社会的責任であると認識しています。さらに、当社グループでは、15年以上前から植樹などの森林整備活動に参加し、自然環境の保全にも積極的に取り組んでいます。
Risk management
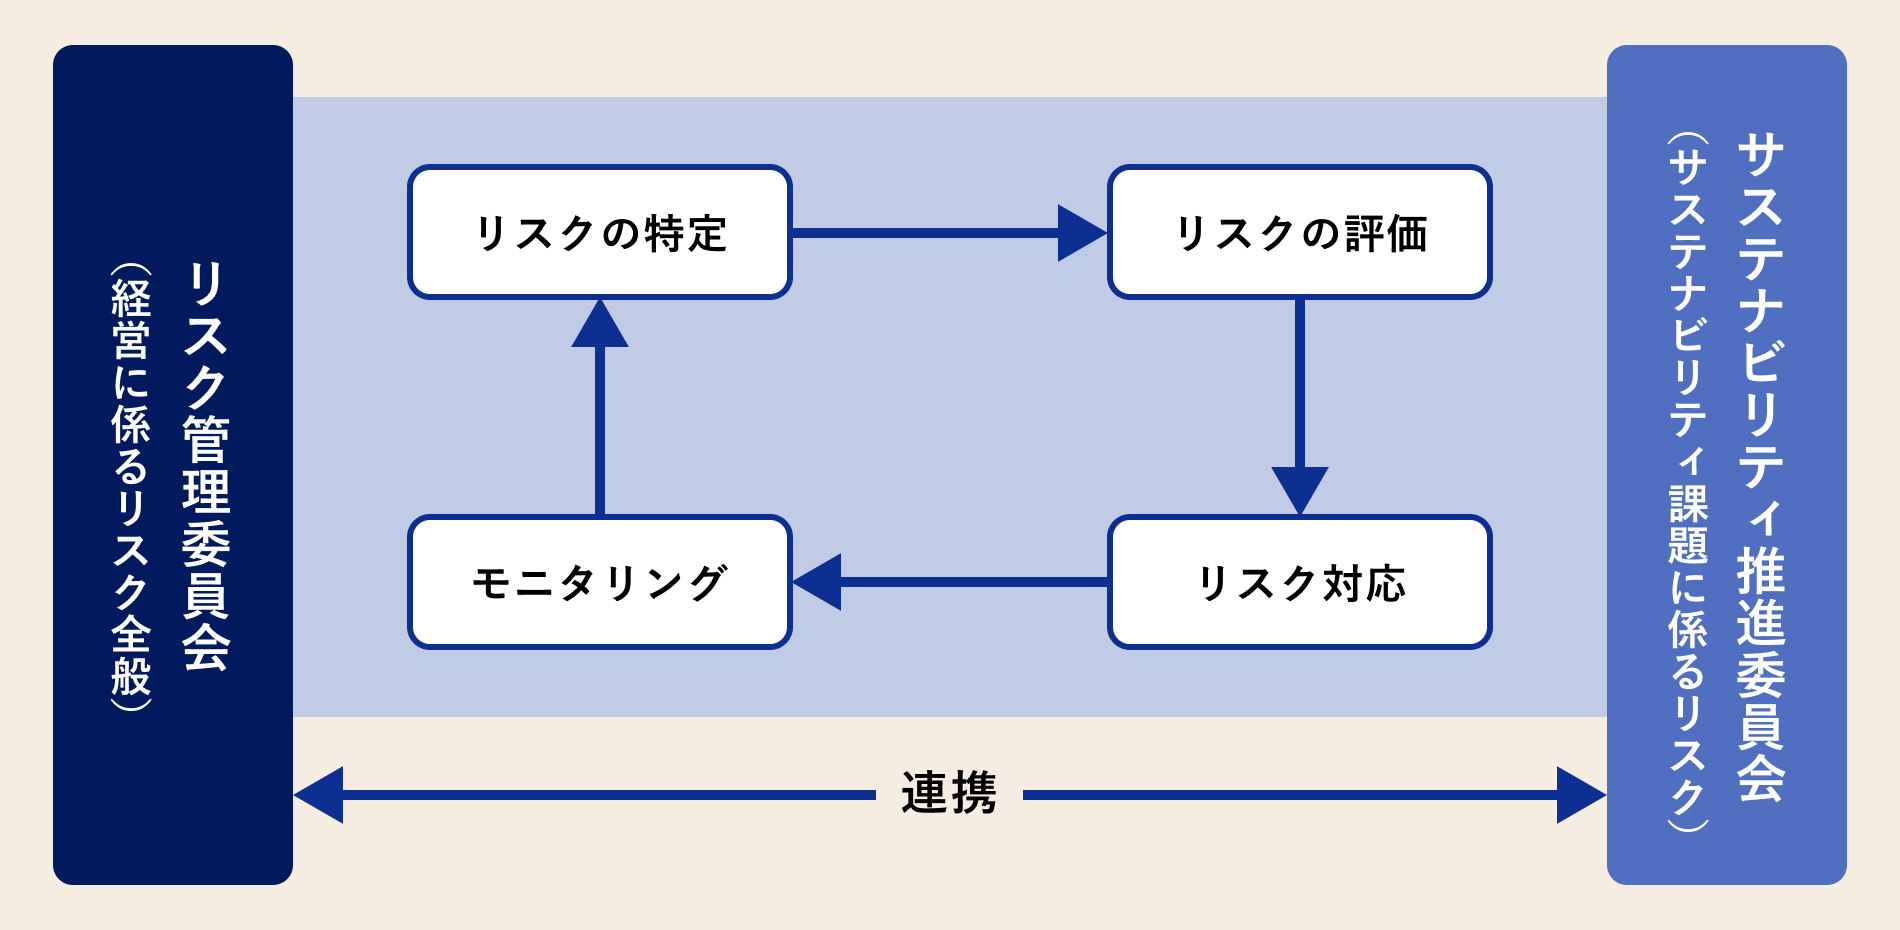
気候関連のリスク及び機会の評価・管理については、サステナビリティ推進委員会で実施しています。同委員会において、気候関連のリスク及び機会の特定・評価・管理手法についても審議・決定のうえ、取締役会に報告しています。また、識別した気候関連のリスクは「移行リスク」と「物理的リスク」に分類のうえ、財務的影響を評価し、重要なリスク及び機会を特定後にリスク管理委員会と協議を行い、対応策を検討しています。
Indicators and targets
[Indicators and targets]
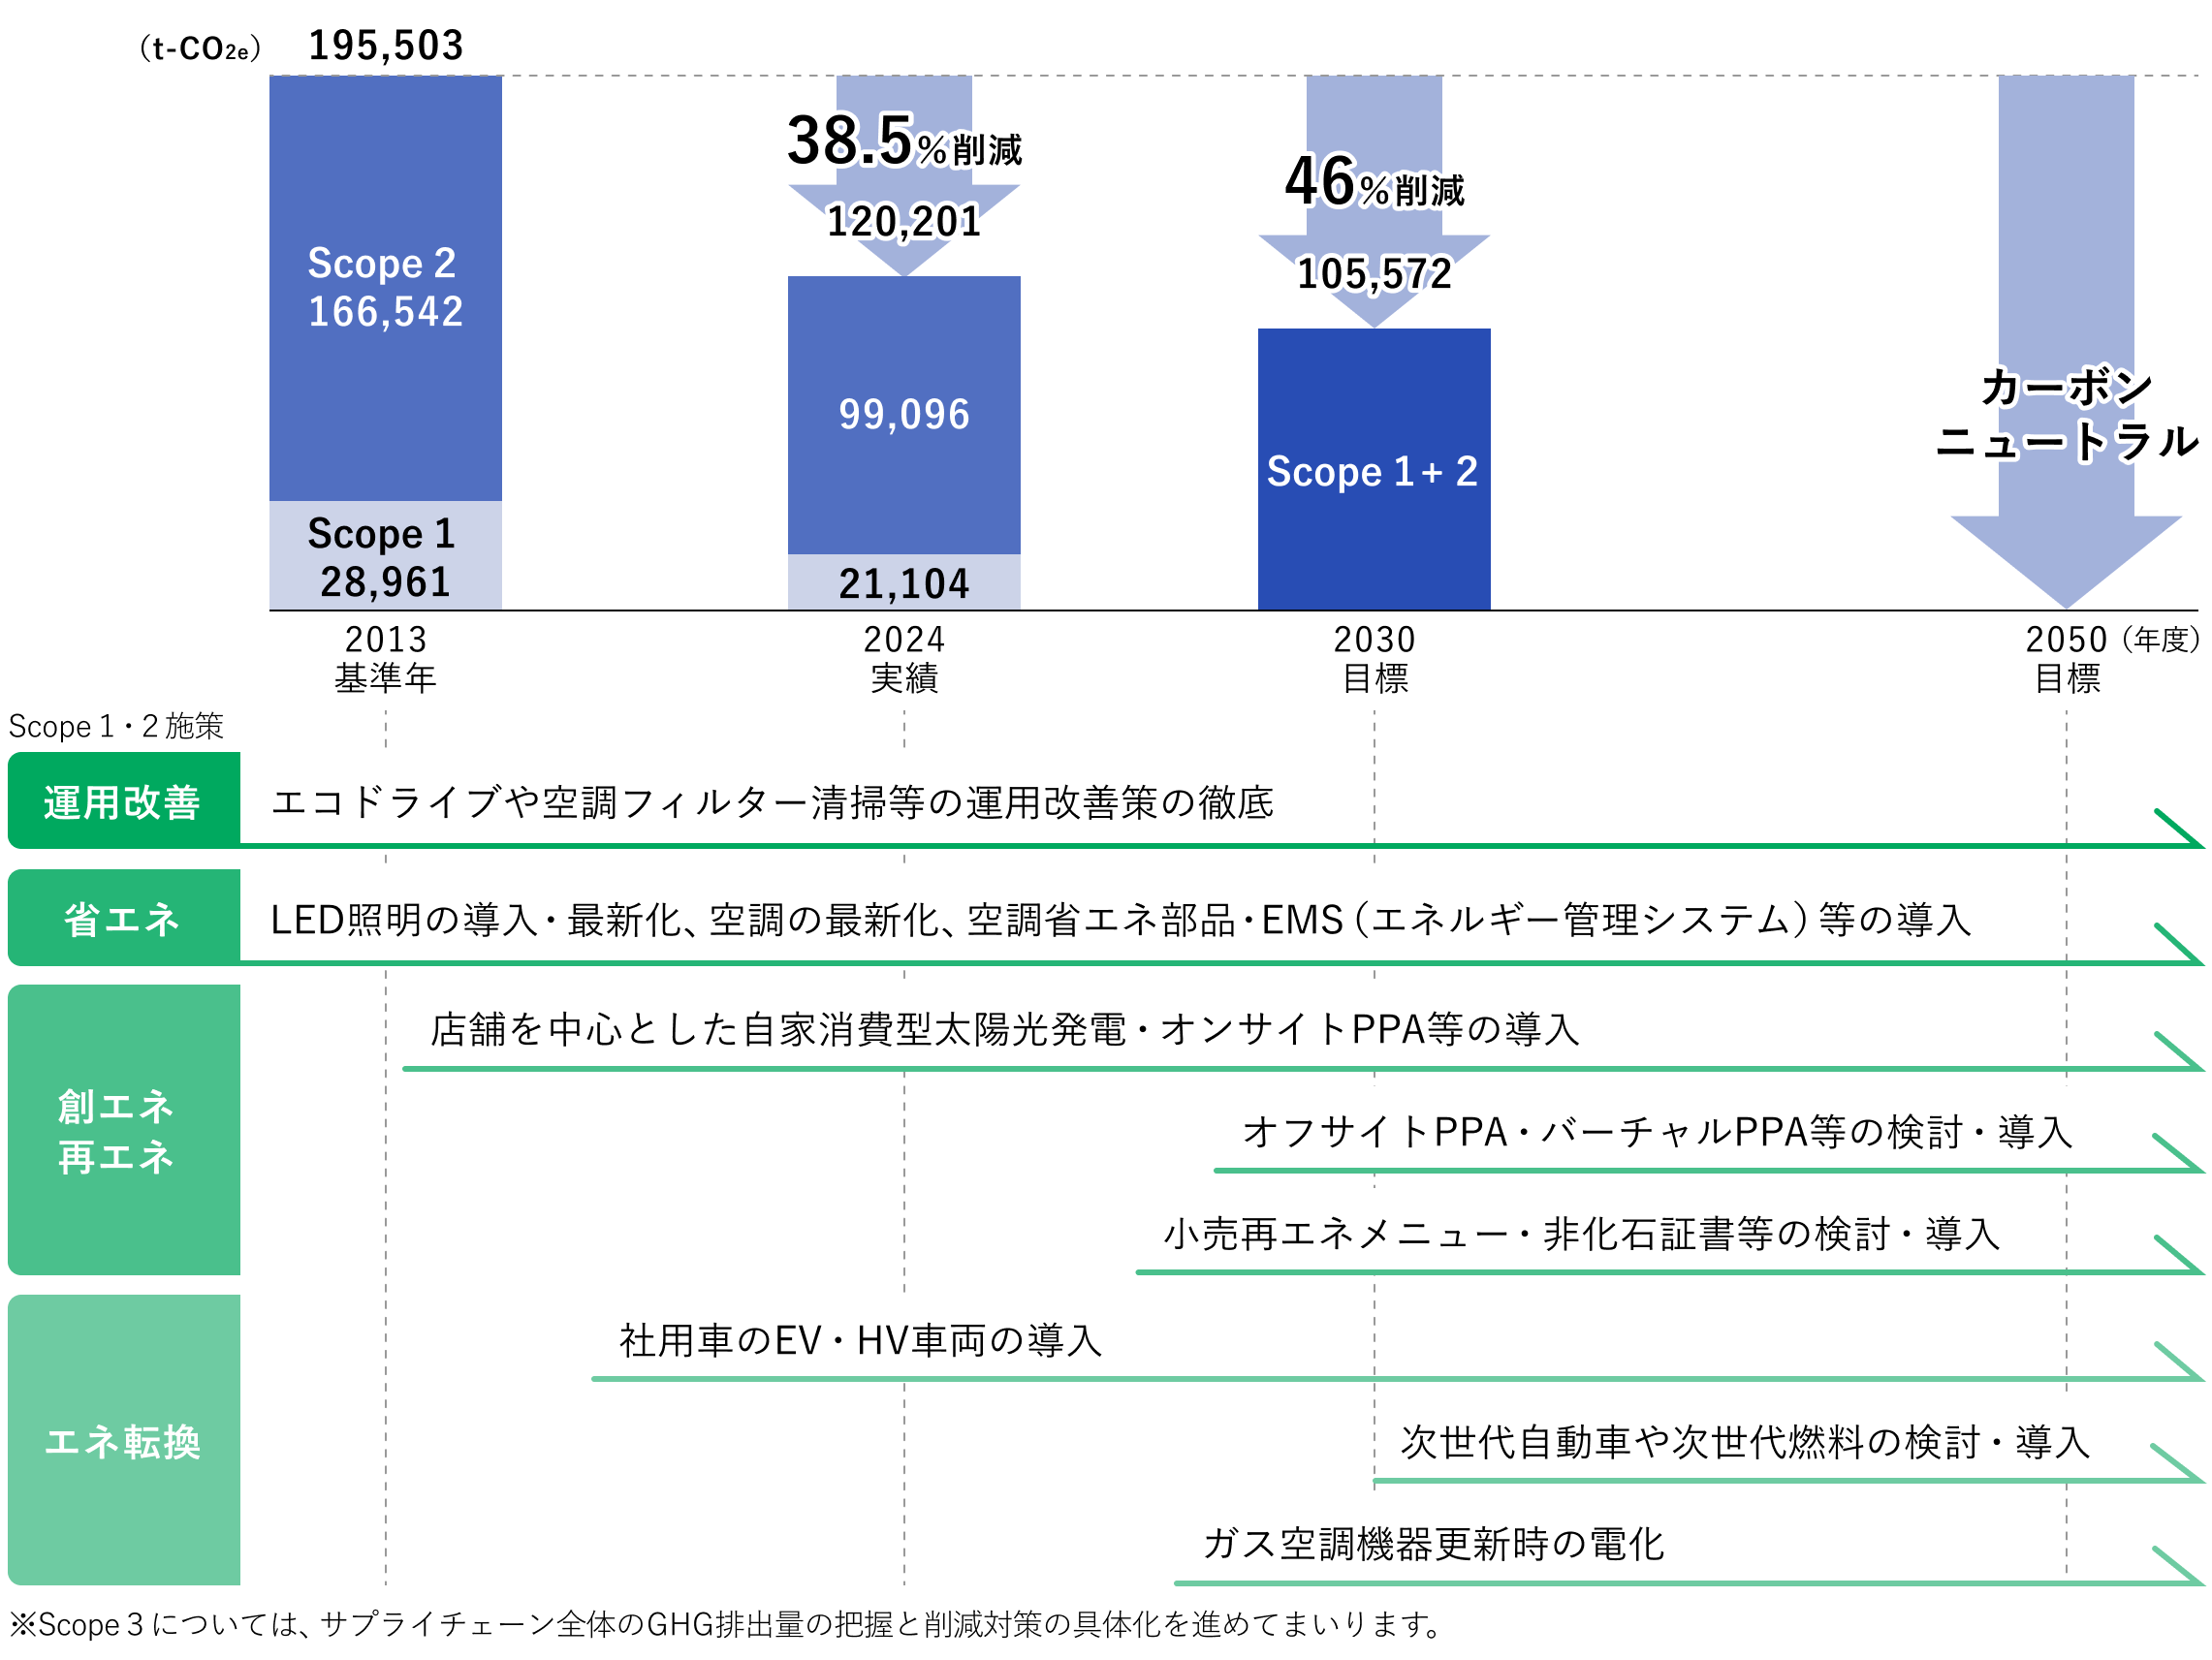
エディオングループは、気候関連のリスク及び機会を管理するために、Scope1・2及びScope3のGHG排出量を指標として定めています。当社グループのScope1・2合計のGHG排出量について、2030年度までに2013年度比46%削減を目標とし、長期的には2050年度までにカーボンニュートラルの実現を目指しています。この削減目標を着実に実行するため、2025年3月のサステナビリティ推進委員会において、GHG削減ロードマップを策定しました。省エネ活動の運用改善、高効率なLED照明や空調設備への更新、太陽光発電設備の導入拡大、社用車のEV・HV車両導入など、GHG削減ロードマップに基づき計画的かつ段階的に推進していきます。なお、Scope3については今後、サプライチェーン全体のGHG排出量の把握と削減対策の具体化を進めていきます。
【GHG排出量(Scope1・2・3)】
エディオングループは、事業活動におけるグループ全体のGHG排出量の算定に取り組んでおり、2025年度のScope1・2合計のGHG排出量は、117,755t-CO2e(2013年度比39.8%削減)を見込んでいます。また、2025年度のScope3のGHG排出量は、9,754,122t-CO2e(2022年度比8.1%削減)の見込みです。なお、GHG排出量の信頼性を確保するため、2024年度のScope1・2・3の実績値については、独立した第三者による限定的保証を取得しています。2025年度は速報値であり、現在、第三者保証の手続きを進めています。
当社グループのScope1・2・3のGHG排出量推移は以下のとおりです。
〈Scope1・2のGHG排出量実績及び見通し〉
(Unit: t-CO2e)
| Fiscal Year 2013 Base year | 2023 | 2024 | 2025年度 速報値 | 2025年度-2013年度 対比(増減率) | |
|---|---|---|---|---|---|
| Scope 1 Direct emissions from the Group (Gas, petrol, diesel, etc.) | 28,961 | 18,433 | 21,104 | 20,960 | 72.4%(△27.6%) |
| Scope 2 Supplied by other companies Indirect emissions (electricity, etc.) | 166,542 | 100,198 | 99,096 | 96,796 | 58.1%(△41.9%) |
| Scope 1 + Scope 2 Total | 195,503 | 118,631 | 120,201 | 117,755 | 60.2%(△39.8%) |
- *Applies to our company and its consolidated subsidiaries.
- ※ Scope1のエネルギー起源GHG排出量は、環境省・経済産業省が温対法に基づき公表する排出係数を使用しています。
また代替フロン(HFC)排出量は、フロン排出抑制法に基づき算定しScope1に含まれています。 - ※ Scope2はマーケット基準を採用しています。電力のGHG排出係数は、環境省・経済産業省が公表する各年の電気事業者別調整後排出係数を使用しています。
- * If figures are rounded, the total may not necessarily equal the sum of the figures.
- ※ 2025年度は速報値のため、今後の確定に伴い変更が生じる可能性があります。
〈Scope3のGHG排出量実績及び見通し〉
(Unit: t-CO2e)
| Fiscal Year 2022 Base year | 2023 | 2024 | 2025年度 速報値 | 2025年度-2022年度 対比(増減率) | |
|---|---|---|---|---|---|
| Scope 3 Values other than Scope 1 and 2 -Indirect emissions along the chain | 10,613,896 | 10,554,915 | 10,117,475 | 9,754,122 | 91.9%(△8.1%) |
〈Scope3カテゴリー別内訳〉
(Unit: t-CO2e)
| Scope3カテゴリー/年度 | Fiscal Year 2022 Base year | 2023 | 2024 | 2025年度 速報値 | 直近年度のScope3 カテゴリー内構成比 |
|---|---|---|---|---|---|
| 1. Purchased Products and Services | 2,100,553 | 2,108,690 | 2,227,460 | 2,302,379 | 23.6% |
| 2. Capital Goods | 21,041 | 71,604 | 52,686 | 38,609 | 0.4% |
| 3. Not included in Scope 1 or 2 Fuel and Energy Activities | 14,422 | 14,551 | 20,300 | 20,353 | 0.2% |
| 4. Transportation and delivery (upstream) | 38,026 | 38,362 | 38,717 | 39,110 | 0.4% |
| 5. Waste generated from business operations | 23,641 | 21,313 | 21,320 | 19,476 | 0.2% |
| 6. Business trips | 1,212 | 1,200 | 1,214 | 1,193 | 0.0% |
| 7. Employee Commuting | 5,077 | 4,959 | 4,707 | 4,747 | 0.0% |
| 8. Leased assets (upstream) | ー | ー | ー | ー | ー |
| 9. Transportation and distribution (downstream) | ー | ー | ー | ー | ー |
| 10. Processing of sold products | ー | ー | ー | ー | ー |
| 11. Use of sold products | 8,306,605 | 8,189,305 | 7,683,624 | 7,255,757 | 74.4% |
| 12. Disposal of sold products | 85,200 | 85,404 | 50,932 | 57,822 | 0.6% |
| 13. Leased assets (downstream) | 7,840 | 9,121 | 9,915 | 8,089 | 0.1% |
| 14. franchised | 9,910 | 10,037 | 6,300 | 6,129 | 0.1% |
| 15. Investment | 370 | 370 | 300 | 458 | 0.0% |
| Scope 3 Total | 10,613,896 | 10,554,915 | 10,117,475 | 9,754,122 | 100.0% |
- ※ カテゴリー1~10は当社及び連結子会社、カテゴリー11・12・14は当社及び一部の連結子会社、カテゴリー13・15は当社を対象としています。
- ※ カテゴリー8は、Scope1・2に含んでいます。
- ※ カテゴリー9は、カテゴリー4に含む輸送・配送を除き、合理的な算定が困難なため未算定としています。
- ※ カテゴリー10は、該当がありません。
- * If figures are rounded, the total may not necessarily equal the sum of the figures.
- ※ 2025年度は速報値のため、今後の確定に伴い変更が生じる可能性があります。